Understanding Morningstar Correlation Reports
Before looking at the Morningstar correlation matrix, first let’s review what correlation means and how it can affect investment performance. Correlation refers to the degree to which investments within a portfolio share similar risk and return characteristics. A portfolio bearing assets that are highly correlated is less diversified. As a result, high correlation is associated with greater risk in the form of volatility. By contrast, the more diversified a portfolio is, the lower the correlation of its underlying assets, reflected as lower volatility. Investments can even be negatively correlated, which means they exhibit characteristics that tend to make them perform inversely to one another.
If you’re looking to protect, preserve and enhance the value of your investment portfolio, creating a Morningstar correlation matrix can help you do it. This Morningstar report helps you better understand the investments held within a portfolio, as well as make informed decisions about what to do with them in order to protect, preserve and enhance the portfolio. That’s why it’s important to understand the Morningstar correlation matrix and how to use it.
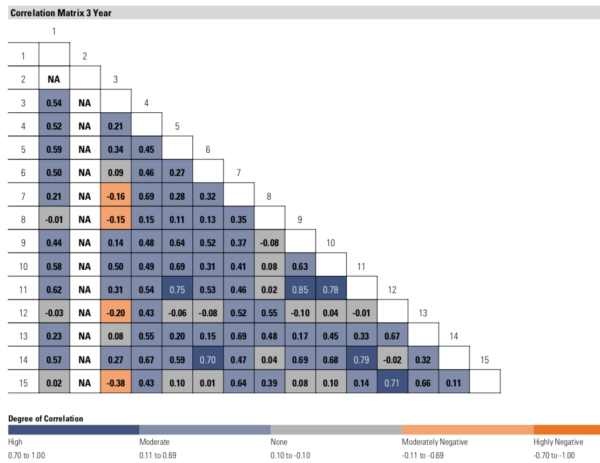
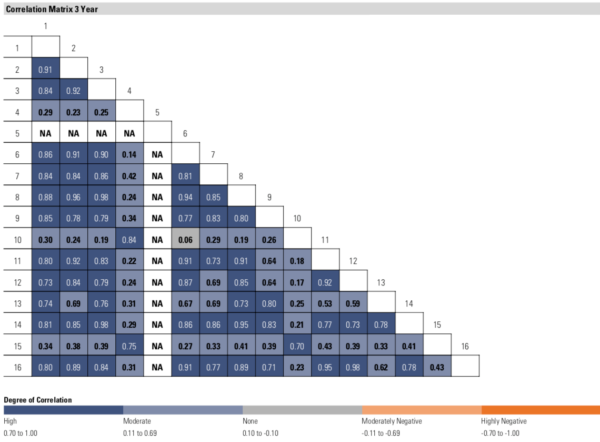
The matrix offers a graphical representation of how investments have performed historically, relative to one another. You can use it to compare and contrast two different investments and even two different types of investments such as an exchange-traded fund, mutual fund, fixed income or equity. Let’s take a look at a couple of examples – one matrix that represents higher diversification – i.e., one prone to less volatility – and a second matrix that represents lower diversification – i.e., one prone to more volatility.
A healthy correlation matrix
The matrix is color coded according to the degree of correlation: dark blue represents high correlation, light blue is moderate, grey is neutral, light orange is moderately negative and orange represents highly negative correlation. A robust correlation matrix exhibits a variety of mostly low, and some neutral and negatively correlated assets. In fact, in an ideal correlation matrix, no more than 30 percent of the boxes are dark blue or highly correlated.

The first chart illustrates historical performance over a three-year timeframe. Let’s look at the correlation between two hypothetical assets – number three and number four. By lining up asset number three on the vertical axis where it intersects with asset number fifteen on the horizontal axis, we find that over the three-year period represented there is a moderately negative performance correlation of -0.38. This number, -0.38, does not represent investment performance. Rather, -0.38 represents a coefficient – a single point on a linear trajectory ranging from 1.0 (most highly correlated) to -1.0. (most negatively correlated).
In this case, over the three years represented, asset numbers three and four have exhibited a moderate tendency to perform inversely to one another. When you’re trying to maintain diversification, it’s useful information because it tells you there’s a higher likelihood that asset numbers three and four will perform differently from one another during a given time frame. It even means that the two investments could be used as a hedge against one another. A moderately negative correlation like -0.43 means that the positive performance of one investment may be used to offset the negative performance of the other, which also reduces extreme performance swings, i.e. volatility.
Putting all your eggs in one basket
Now let’s look at matrix example number two, which represents a portfolio with a high degree of correlation between its underlying investments, meaning the portfolio is prone to higher volatility. A large percentage of matrix two is covered by dark blue boxes; consequently, the investments’ performance are highly correlated to one another. As a result, the portfolio is poorly diversified, prone to extreme performance swings – up or down – and visually represents the proverbial phrase “putting all your eggs in one basket.”
Essentially it means that, under the right type of economic and market conditions, the portfolio could perform extremely well one year but extremely poorly another year. An investor could see a 35-percent gain one year, for example, but a 45-percent loss the next year. By changing the asset mix to reduce the number of dark blue squares, the portfolio is less likely to experience extreme upside and downside performance swings over a similar time period.
What are some types of assets that tend to exhibit low or negative correlations? The most basic example is that of stocks and bonds. Historically, and generally speaking, a rising stock market is bad for bonds and vice versa. This is merely one example and is not a universal truth that applies to all stocks and all bonds under all scenarios. However, knowing that a diversified mix of equity and fixed-income investments helps lower volatility is a useful rule of thumb as you evaluate the positions held within a portfolio.
Speak with your financial advisor and work together to diversify a highly correlated portfolio so that no more than 30 percent of the assets appear as dark blue squares. Instructions on creating your own Morningstar matrix are here: LINK. Ask your advisor to recommend how you can reduce volatility by diversifying your portfolio into lower correlated investments that have a lower tendency to respond in the same way to market and economic conditions.
Visit Morningstar.com and subscribe for a free 14-day trial. Insert your investments into the matrix and customize it to see a graphical representation of your correlations. Add or remove potential investment choices to create and test new models. Please remember that it’s all based on historical data, so past performance is not a guarantee of future performance.
If you have questions about investment correlation, Morningstar reports, or preserving the value of your portfolio, please contact us at (800) 880-2760 or contact@courtinvestmentservices.com.

